What’s the Point?
The slope at various points on a curve of a set of data helps to understand the data. If the slope values are used as data to create a new curve, the slope of that curve gives even more insight into the data.
TL;DW
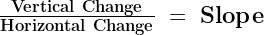
- In this example, the data is from measuring the distance a ball has fallen vs the time it’s been falling. Distance is on the Y axis and the time falling on the X axis. Since slope is defined as:
The slope at any point on this data curve is:
- The slopes, which are velocity, can be calculated at several points using the equation of the curve the spreadsheet created. Then these slope values can be used create a new curve. This new curve has the slope (velocity) at each point on the Y axis, and the time at each point on the X axis. So, it’s a graph of the velocity vs time, which in this case keeps increasing at a constant rate.
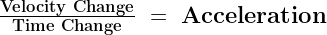
- The slope of a curve of velocity vs time is:
- Since the data was originally the distance a dropped ball had fallen vs the time it has fallen, the slope (acceleration), is the gravitational acceleration.
- The velocity values all fall on a straight line, so the slope is constant for all the data points because gravity is constant.

Where To:
What is Slope Velocity Y Intercept
Fitting Line to DataSlope on Curves Curve Example
The Worksheet Khan Academy
Khan has lots of examples!